

Seeing Without Thinking: Part Two
FM (Friday Morning) Reflection #19

This is Part Two of the thread I started in FM (Friday Morning) Reflection #17. In case you missed it or want a refresher, I’ve included a link to it below. For today’s Reflection, I've prepared a bit of show and tell—a short primer with a few examples to improve data literacy and comprehension—one chart at a time.
-Eric

In Seeing Without Thinking: The Built-In Visual Cues Your Brain Already Knows, I reflected on the visual variables first identified by French cartographer and theorist Jacques Bertin. These attributes are:
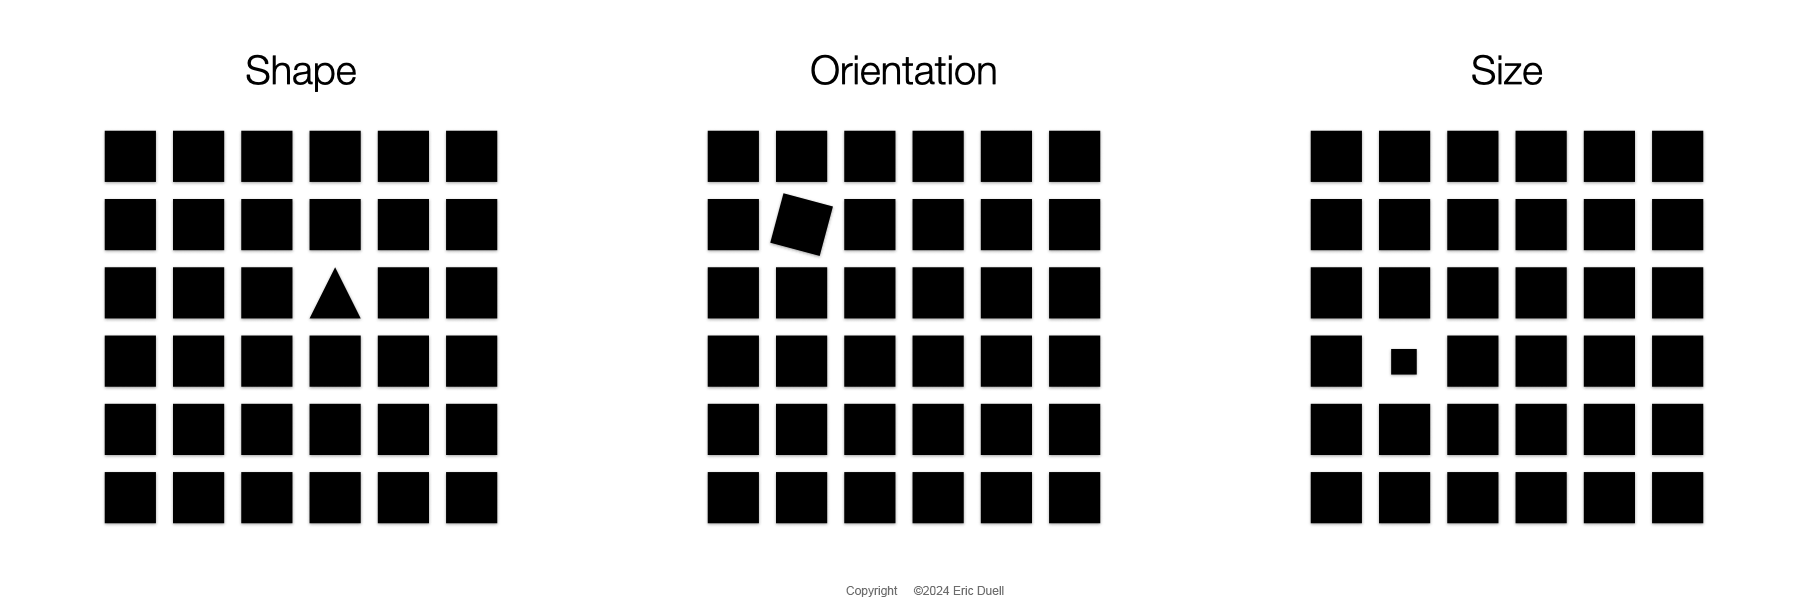
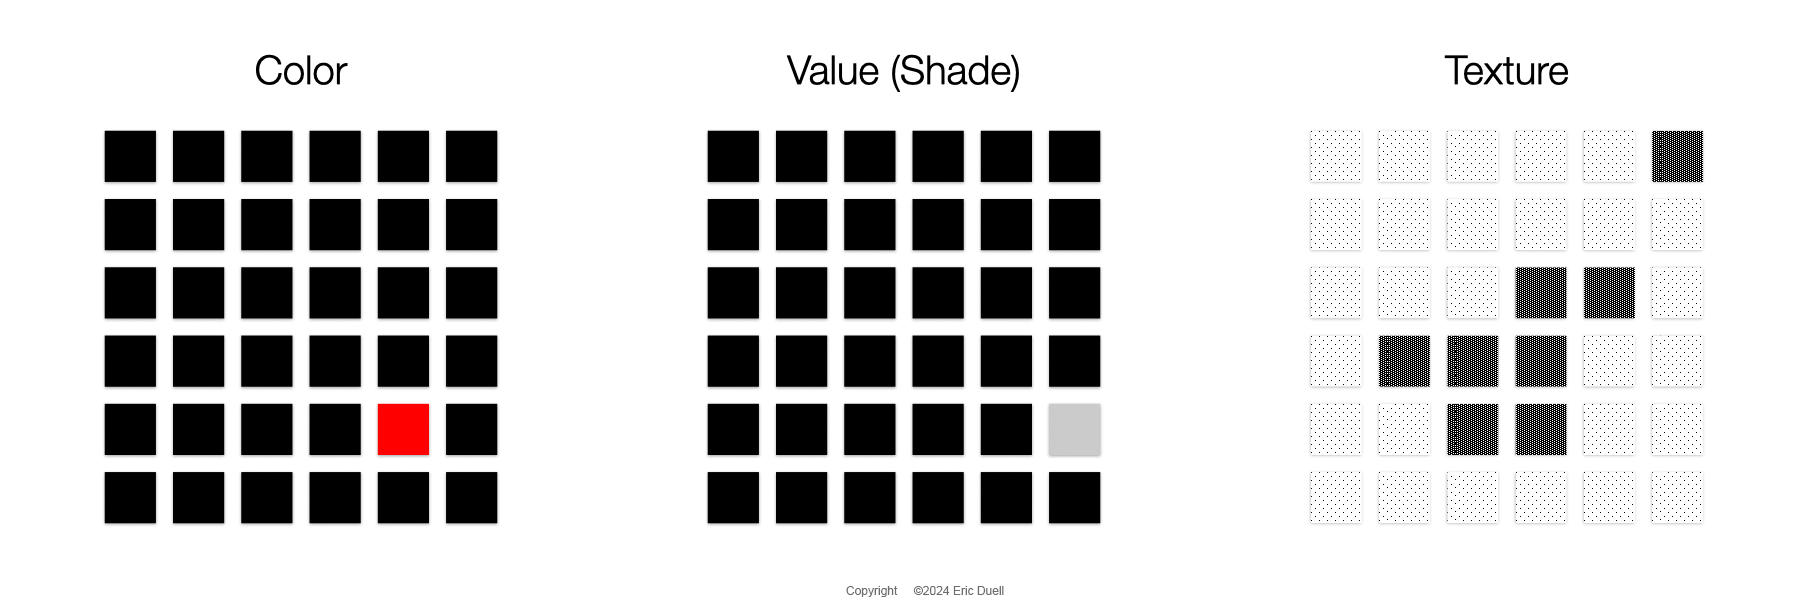
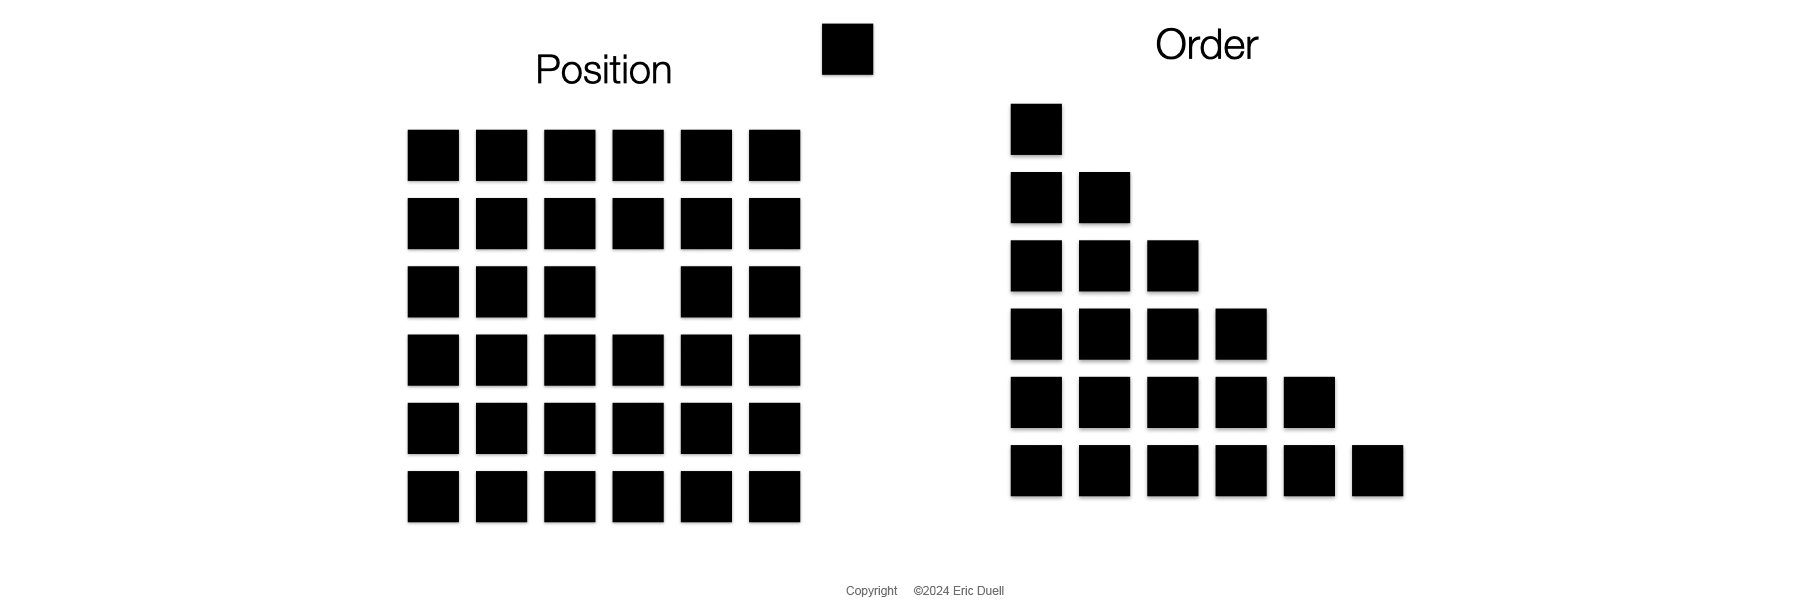
These visual attributes are pre-attentive—we notice them without actively thinking about what we’re seeing. Our perception is highly attuned to notice differences in these attributes within a set, and these differences automatically activate our attention.
Life Lessons
One of the most valuable lessons I’ve learned as a driver of change is to focus attention on what matters most. And in our contemporary world, where making sense of data and refining it into information and knowledge is one of the ways we create value, use of the visual variables that Bertin identified gives us a leg up—both when we need to make a point and to more effectively decode data as a recipient.
Knowing what to look at also means knowing what is not important, especially when faced with nearly endless choices (doom scrolling, online shopping, and soooo many varieties of ice cream at the store).
In a work environment, I've experienced leaders who demand that every pebble be turned over just to see if there’s something there, leaving analytics and their partner business teams exhausted and mired in analysis paralysis. When instigated without the context of a coherent strategy, this often results in wasted effort and only serves to drive cycles of second guessing and self-doubt.
Wouldn't it be great if we could more effectively show (instead of tell) that the answer is vanilla—and that it's not worth a dive into the voluminous varieties of available chocolate infused concoctions? I say so, although I will admit to a bit of glee when I score a Heath-infused Klondike bar after a thorough search of the freezer section at my local grocery store.
Focus is Job One
A key job of the analyst is to drive focus: Here’s what we can see, here’s what we can surmise, and if needed, here’s where we should look further.
This is where the knowledge of visual design principles comes in. Specifically, how we incorporate these principles into presenting data—and whether we should provide a high-level overview or zoom in on a specific issue like the performance of a new product line.
Commonly used spreadsheets often don’t make this easy. I've heard it said, “take whatever Excel chooses as the defaults for your chart—and do the opposite.”
I know I've spent hours fiddling with different shapes, colors, and options to create a chart for an important presentation, only to feel it’s not getting the story across.
In Seeing Without Thinking, I shared a quick 1-2-3 recipe to improve the effectiveness of your data visualizations and charts:
Remove anything unnecessary: Extra grid lines, redundant axis labels, meaningless colors, and 3D effects—take out anything that isn’t essential.
Stick to basic chart types: Bar, line, and scatterplot charts cover the vast majority of use cases.
Use pre-attentive attributes wisely: Direct your reader’s attention by leveraging these attributes.
I've put together a few examples of this in action to help illustrate the point using the attributes color, order, and value.
Practical Application
Let’s assume your data is clean, you know your audience, and you’re working with widely available tools—in this case I chose to work in Google Sheets.
Disclaimer: I have much more experience with Excel and Tableau vs. Google Sheets, so this was a learning experience for me too, and it put me into a beginner's mindset.
I started with a curated data set I’ve used in teaching for many years: ice cream sales from a fictional Good Old Tyme Ice Cream Company (GOT Ice Cream). The data include monthly sales revenue and product variety (chocolate, vanilla, etc.).
Below you can see a pivot table view of the data, filtered down to a subset of varieties.
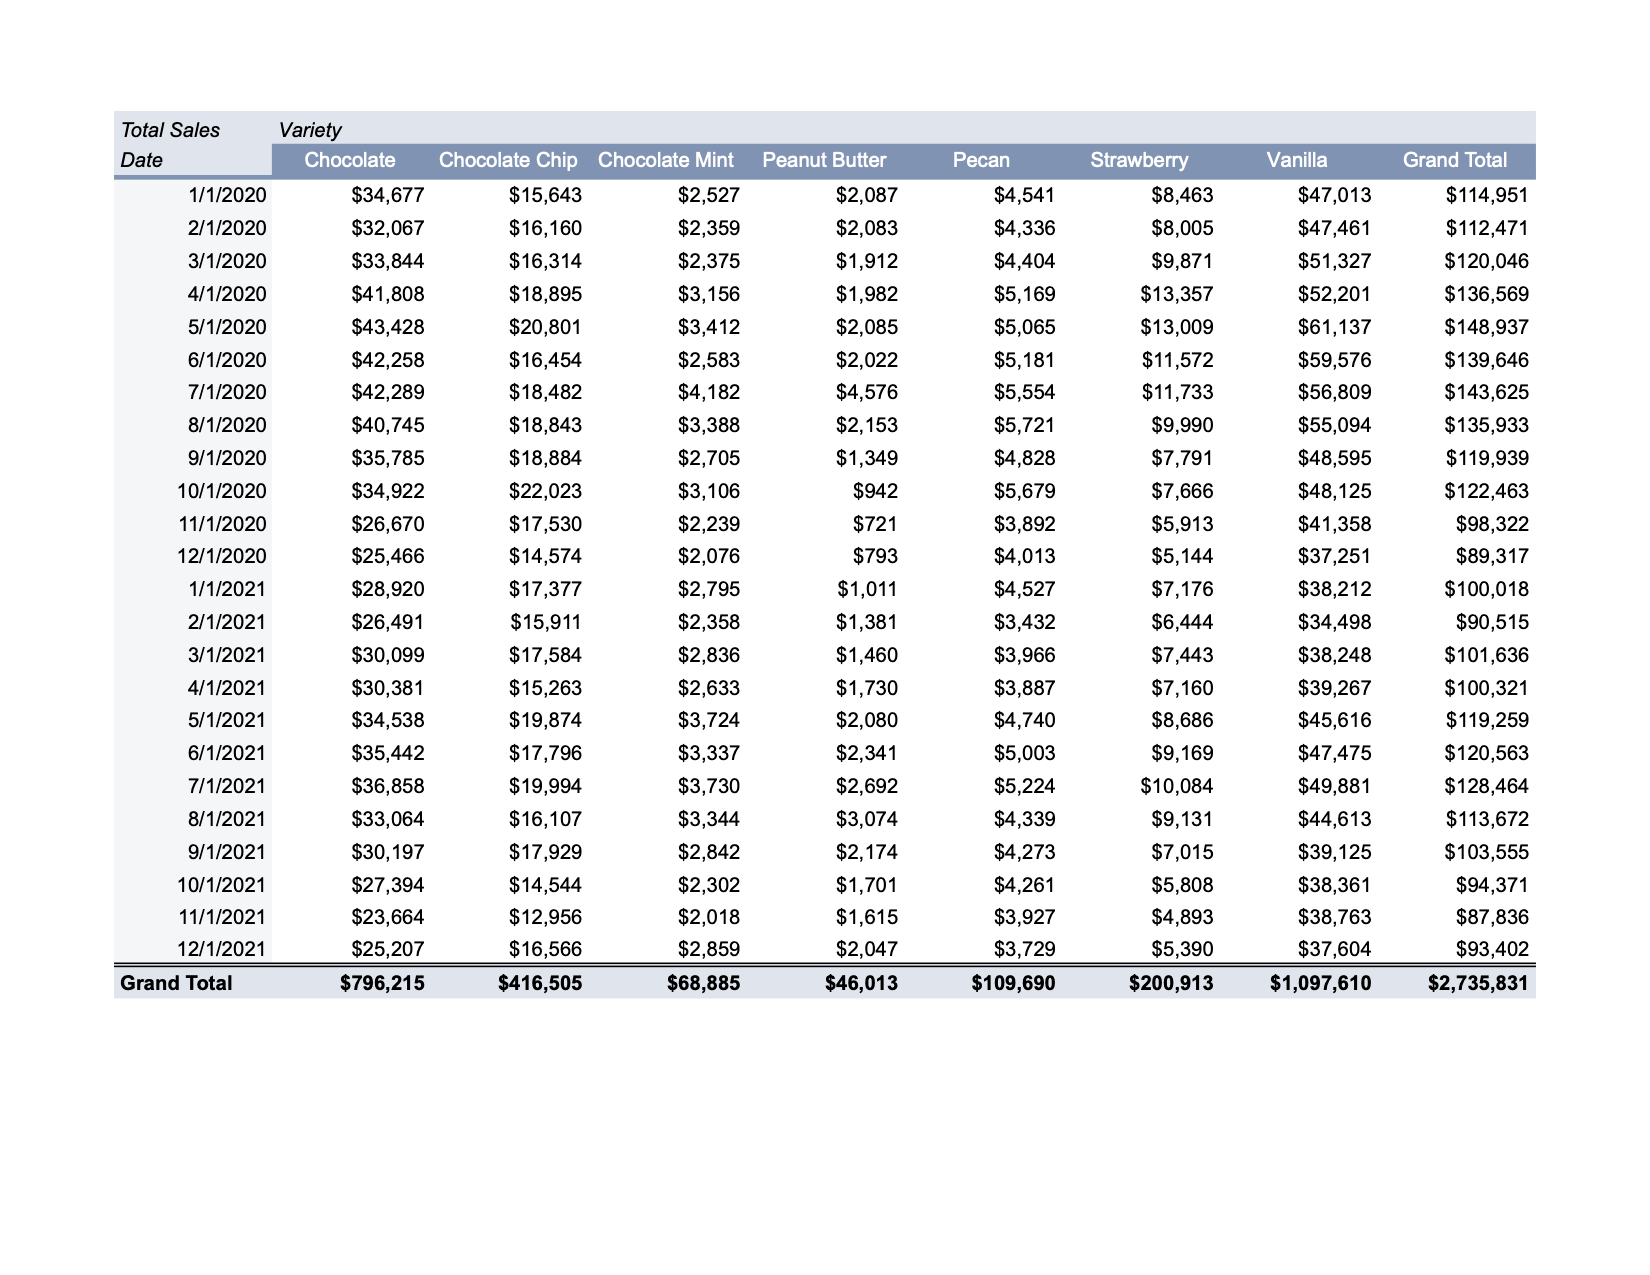
Upon seeing this, it’s likely your eyes glossed over and your brain wanted to run for the exit. That’s because the visual processing system of your brain doesn’t know what to do with this information.
Unfortunately, this type of visualization may be what we’re given, and expect to use to glean the latest trends and make important decisions. There is a name for this type of visualization—it’s called a lookup table—and its name tells you what it does best: provide a way to look up a specific value when you need it. And to understand which products are selling the most, we don’t need this chart right now.
I also find it helpful to separate the question of total from trend and to visualize those separately. For today, I wanted to focus on total—and to show sales by variety with an order of precedence. I started by putting the data into a chart (minus the date detail, and I’ve also grouped some items to simplify), as shown below.
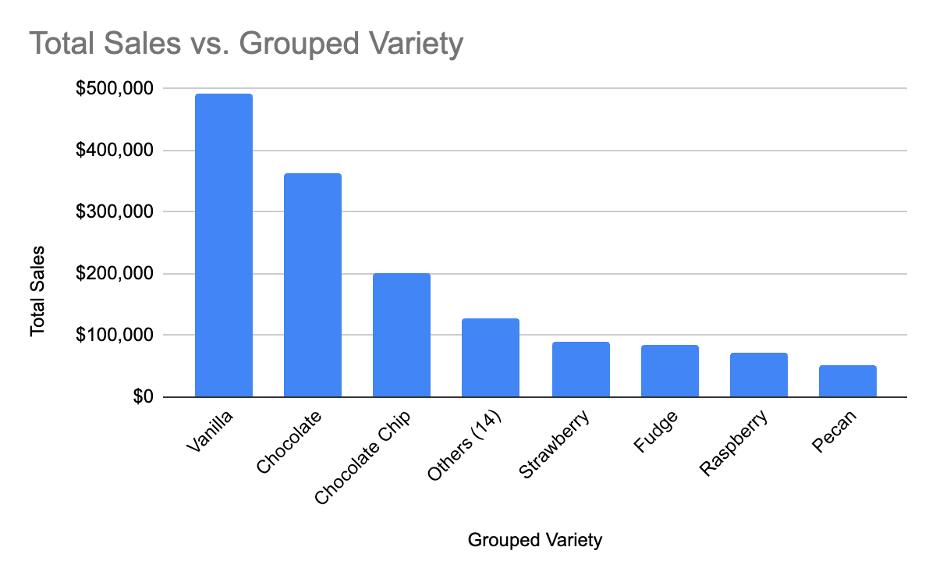
In the chart above, I applied order to rank the sales by variety—and true to form, vanilla reigns supreme in the GOT Ice Cream data set just like in real life. But this is just the start of making the visualization more effective, and instead of adding more toppings to our sundae, I’ll start with taking things away.
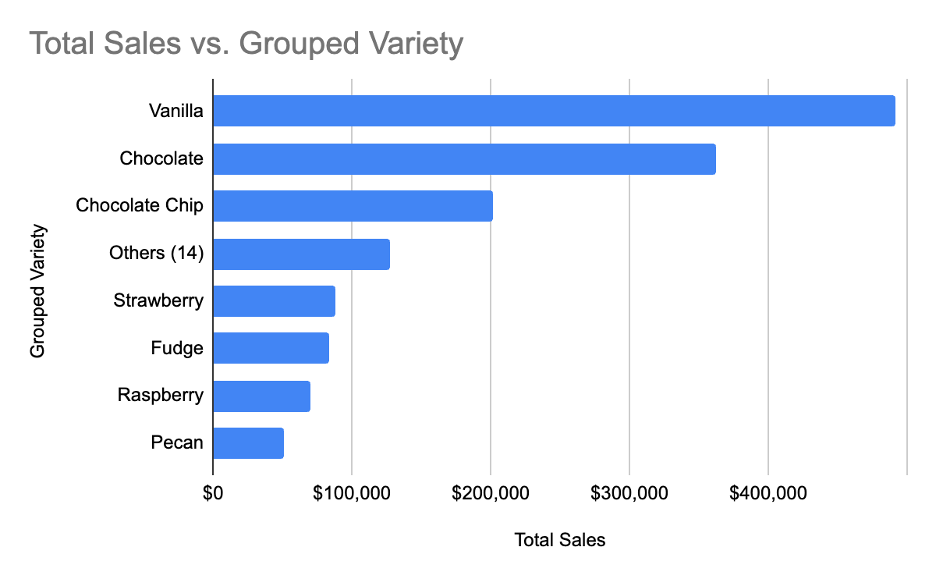
The chart above easier to read than the initial version. Why? I rotated the bar chart 90-degrees so that all the text is horizontal (with the exception of the Y-axis label) —the way we read naturally in English—while the order of the bars maintains a familiar top-to-bottom flow. But there’s still more to remove from the chart to make it more readable.
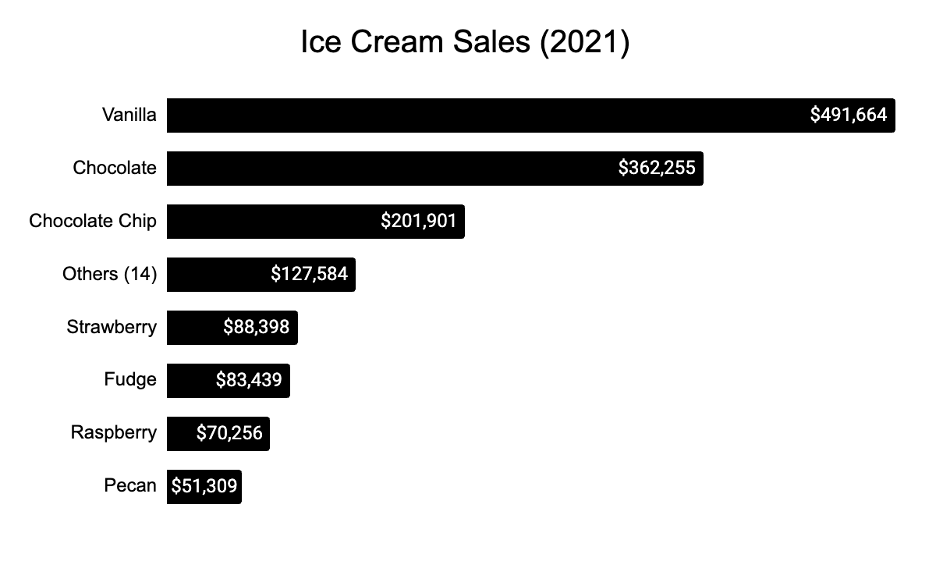
You undoubtedly noticed that I took color completely out of the chart above. Often, when I’m presenting this in person to a group, there is a visceral reaction—why did you take away the color?!?—and if you had the same feeling, I invite you to sit with the chart above for a moment.
In fact, the blue color added no additional information to understanding the data. However, because color is a pre-attentive attribute, it captured part of our attention, which was then wasted because there was nothing unique that the color actually drew our attention to notice.
The other changes I made include:
Removing the grid lines
Removing all x- and y-axes and labels
Added data values for each bar, so that you know the value each bar represents
Simplified the title
Compared to our original pivot table, you can now use the chart above to intuitively (and without thinking) answer questions like:
How much more vanilla do we sell than chocolate chip? More than 2x.
What’s our third best seller? Chocolate chip.
Do we get most of our sales from a small number of varieties or are sales equally distributed? Most sales come from a few top sellers: Vanilla, chocolate, and chocolate chip. The 14 varieties with the lowest sales, when all combined, still don’t measure up to those top three.
After the changes, we immediately gain more insight and information from this one chart, and without having to ask anyone to do anything, simply by removing unnecessary items, orienting the chart so that we can more easily read it, and using Bertin’s pre-attentive attributes to our advantage.
I made one more tweak, using value to draw attention to Chocolate Chip, as shown below.
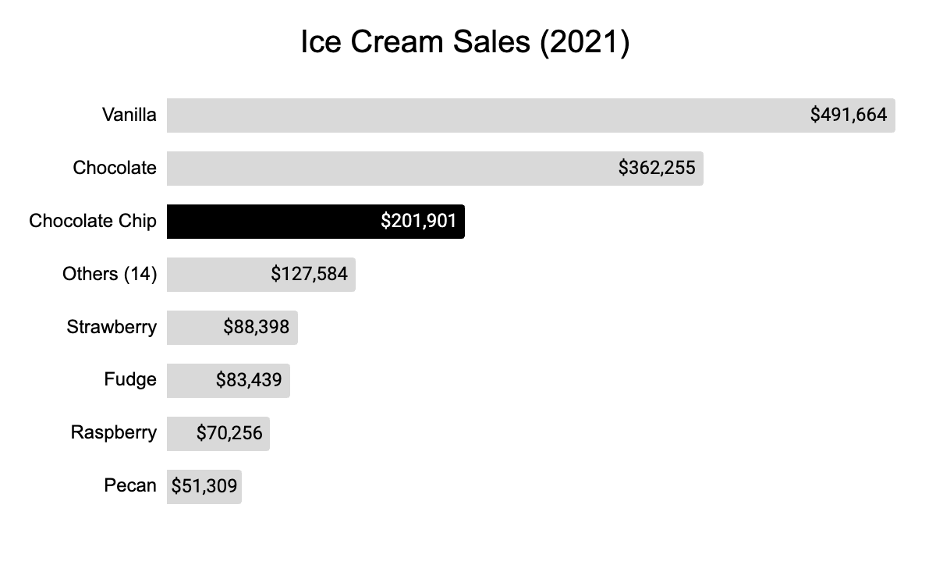
In what may seem like a counterintuitive choice at first, I made all but one of the bars grey, because I wanted to focus your attention on Chocolate Chip. By making the Chocolate Chip bar a different value and with more visual weight than the rest, you can’t not see it.
These are just a just a few examples of how the pre-attentive visual attributes can be used to communicate more effectively with data and charts.
While you’re thinking about it, please share the techniques you've mastered to make your own charts and vizzes more impactful, because we all benefit when you offer your knowledge and expertise. And let me know if you’d like to see more examples in future Reflections.
Have a great weekend!
-Eric
Note: With the included graphics, this Reflection is just about at the limit of what email providers will handle without making you jump out to a link to continue, so there isn’t room for the Photo Bonus today. It will be back soon!